Predicting soybean yields from early season weather
County-level soybean yields for 2018 were predicted from April–July weather, soil moisture and vegetation optical depth using ridge regression and a logistic 'better or worse than usual' classifier, and neither model was found to be of practical use.
Context
This project was done in a pair for the course CS-C3240 Machine Learning at Aalto. Climate change and more frequent extreme weather make harvests harder to plan for, and if the end-of-season yield could be estimated from early-season conditions, producers could plan their logistics, storage and pricing ahead of time. The question was whether soybean yields in the contiguous United States could be predicted from weather, soil and vegetation data from April to July.
A CONUS dataset from Zenodo was used, containing county-level yields of corn, wheat and soybean along with precipitation, maximum temperature, soil moisture, vegetation optical depth (VOD) and enhanced vegetation index. Soybean was chosen as it is widely grown for both human consumption and animal feed. The data covers 515 counties over four years, 2015–2018, giving 2060 data points in total, each one being the yield of a single county in a single year.
Approach
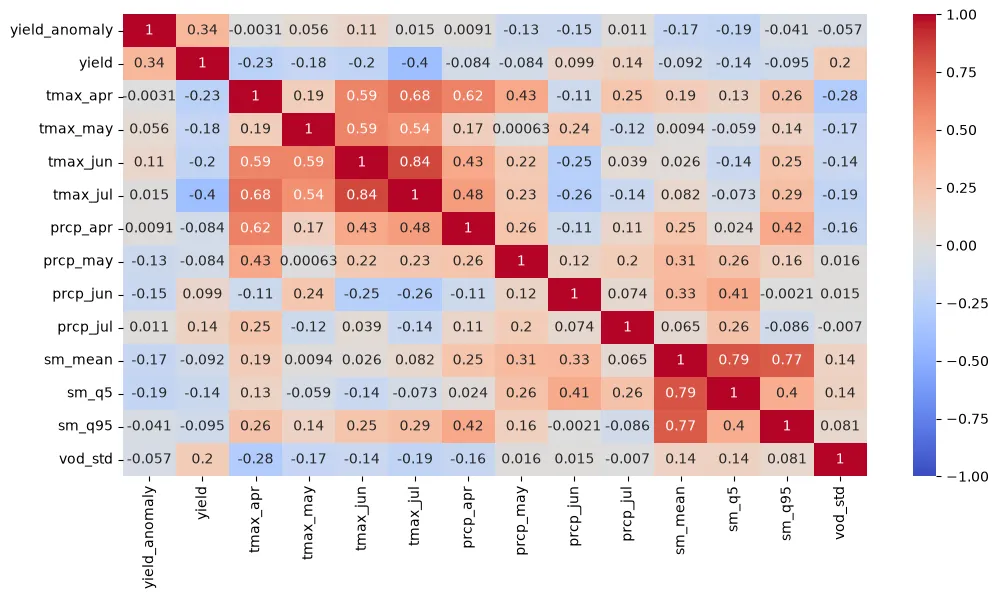
The data was cropped to April–July and the daily soil moisture and VOD measurements were reduced into summary statistics. Features were chosen with the help of a Pearson correlation matrix. 12 features were kept: the monthly maximum temperatures and monthly precipitation for the four months, the mean, 5th and 95th percentile of soil moisture, and the standard deviation of VOD. The standard deviation of VOD was chosen as it follows the change in crop biomass over the season, whereas the mean VOD can be skewed by permanent vegetation in the measurement area. The temperatures were kept despite being strongly correlated with each other, since soybean responds differently to heat at different stages of growth. EVI was dropped as it overlaps with VOD. All features were standardised.
Two models were trained. Ridge regression was used to predict the yield directly, as a linear model was considered the most a four-year dataset can support, and the L2 penalty was needed because of the collinear temperature and soil moisture features. A logistic regression classifier was used to predict whether a county's yield would be better or worse than its 2015–2017 mean, as planning decisions are often binary, e.g. whether to increase or decrease capacity. The classifier used the same features and the same linear hypothesis space, so that differences in the results would come from the problem formulation rather than the model.
The year 2018 was held out as the test set. The regularisation strength of both models was chosen with 3-fold cross-validation where each fold was one year, so that the same county would not show up in both the training and validation data of a fold. The ridge models were scored by RMSE and the classifiers by balanced accuracy, after which the chosen models were refit on all of 2015–2017.
Outcome
Ridge regression settled on α ≈ 264 and gave a training RMSE of 1.83, a validation RMSE of 2.00 and a test RMSE of 2.13, with R² ≈ 0.086. A constant prediction of the mean gives an RMSE of 2.23, so the model is only just better than predicting the same value for every county. The logistic classifier did worse: all cross-validation scores were below 0.5, the strongest regularisation available was chosen, and the weights were shrunk so close to zero that every county was classified as having a better-than-usual year. This gave a test accuracy of 59 % and a balanced accuracy of 0.5, which equals the majority-class baseline. The ROC-AUC of 0.637 shows that the classifier ranks the counties somewhat better than chance, but its predictions are useless as such. Ridge regression was chosen as the final model, but neither model would be of use in practice.
The main problem is the data. Three seasons are not enough for a model to separate the effect of weather from the effect of location, and the test year was unusual, as May 2018 was the hottest May on record in the contiguous US and its maximum temperature was almost two standard deviations above the training mean. Predicting the absolute yield also leaves in the differences between counties in soil, nutrients and farming practices, which the features say nothing about. The regression label should have been made relative to each county, as was already done for the classifier, and a dataset with fewer counties but more years would likely have been more useful.
There are also some flaws in the method itself. The correlation matrices used to select the features were calculated on all four years, test year included, so the 2018 data had some influence on the model before it was tested. Its effect is likely small, but it should have been left out. In addition, the dataset does not state a unit for the yields, so the t/ha given in the report is an assumption, which makes the RMSE values hard to interpret in absolute terms.